With over 4 years of experience in data analytics and applied machine learning, I specialize in transforming complex data into meaningful insights that inform strategy and drive impact. My work spans various domains, supporting teams in solving business challenges through data. Feel free to explore some of my recent work.
I hold a Master of Science in Applied Data Science from Syracuse University, where I focused on data-driven problem solving, AI systems, and scalable analytical solutions. My background combines consulting, research, and product-oriented work, enabling me to bridge the gap between data science and real-world outcomes.
I’m particularly interested in how AI and machine learning can be applied responsibly and effectively across industries from building smarter tools to enabling better decisions. I’m always open to opportunities where data, innovation, and impact intersect.
B.Tech. in Electronics & Communication Engineering
9.15/10
Snagged a full tuition scholarship 💰 for grad school
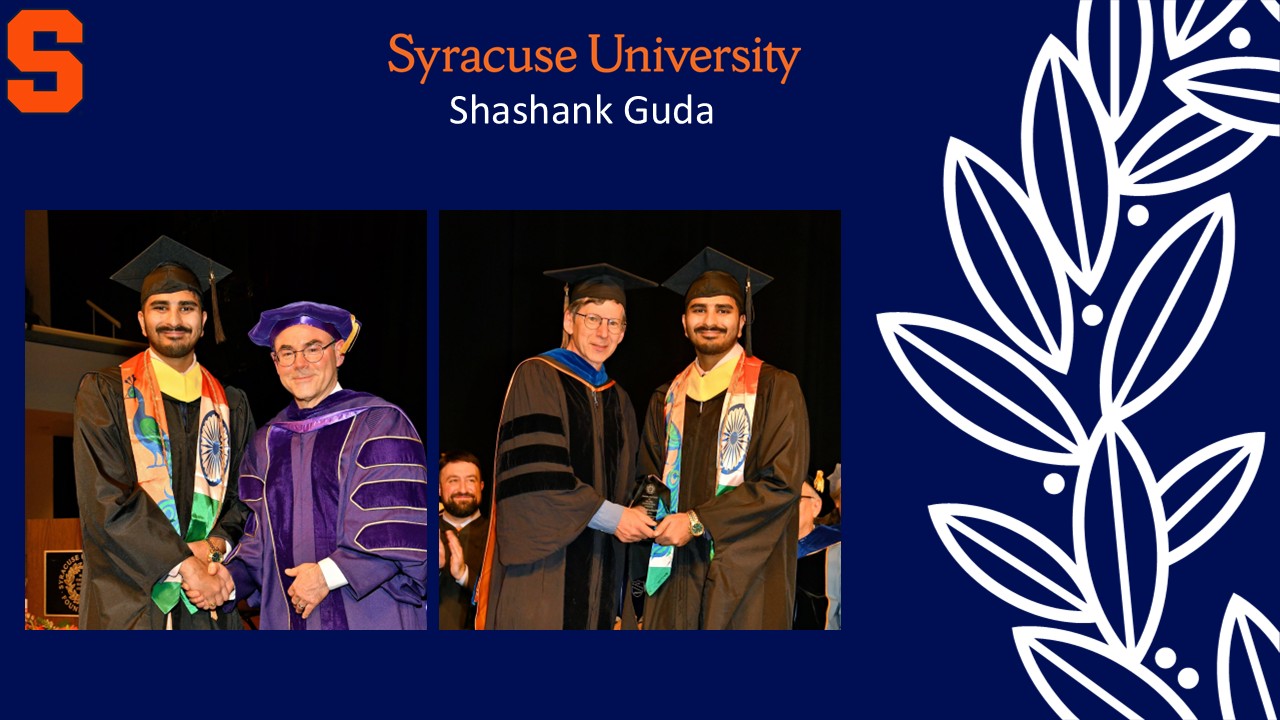
Proud Recipient of the Graduate Student Excellence Award
Honored to receive the Master’s Degree Award for academic excellence and research contributions in the Applied Data Science program at Syracuse University. This recognition is awarded to one graduating student each year and reflects my commitment to impactful, innovation-driven work at the intersection of data science and real-world problem solving. Watch me receive the award ⬇️
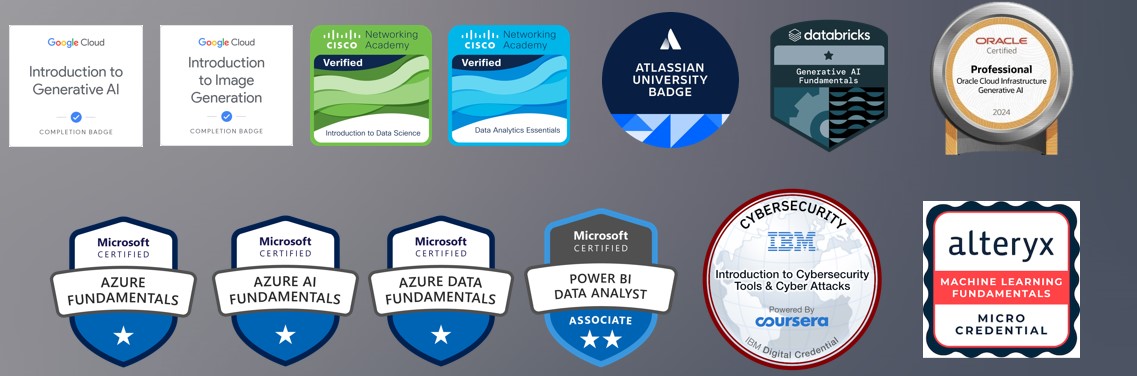
Badges Earned
These badges show my ongoing efforts to keep learning and growing. Each one represents a new skill I’ve picked up or a course I’ve completed. They’re not just symbols; they’re proof of my dedication to staying updated and improving in my field. From learning new tools to exploring advanced analytics, these badges highlight my passion for continuous improvement.
Also worked as a Research Analyst at the School of Information Studies, Syracuse University, where I contributed to AI-focused research exploring real-world applications of emerging technologies and helping shape innovative data-driven solutions.
Inferenz
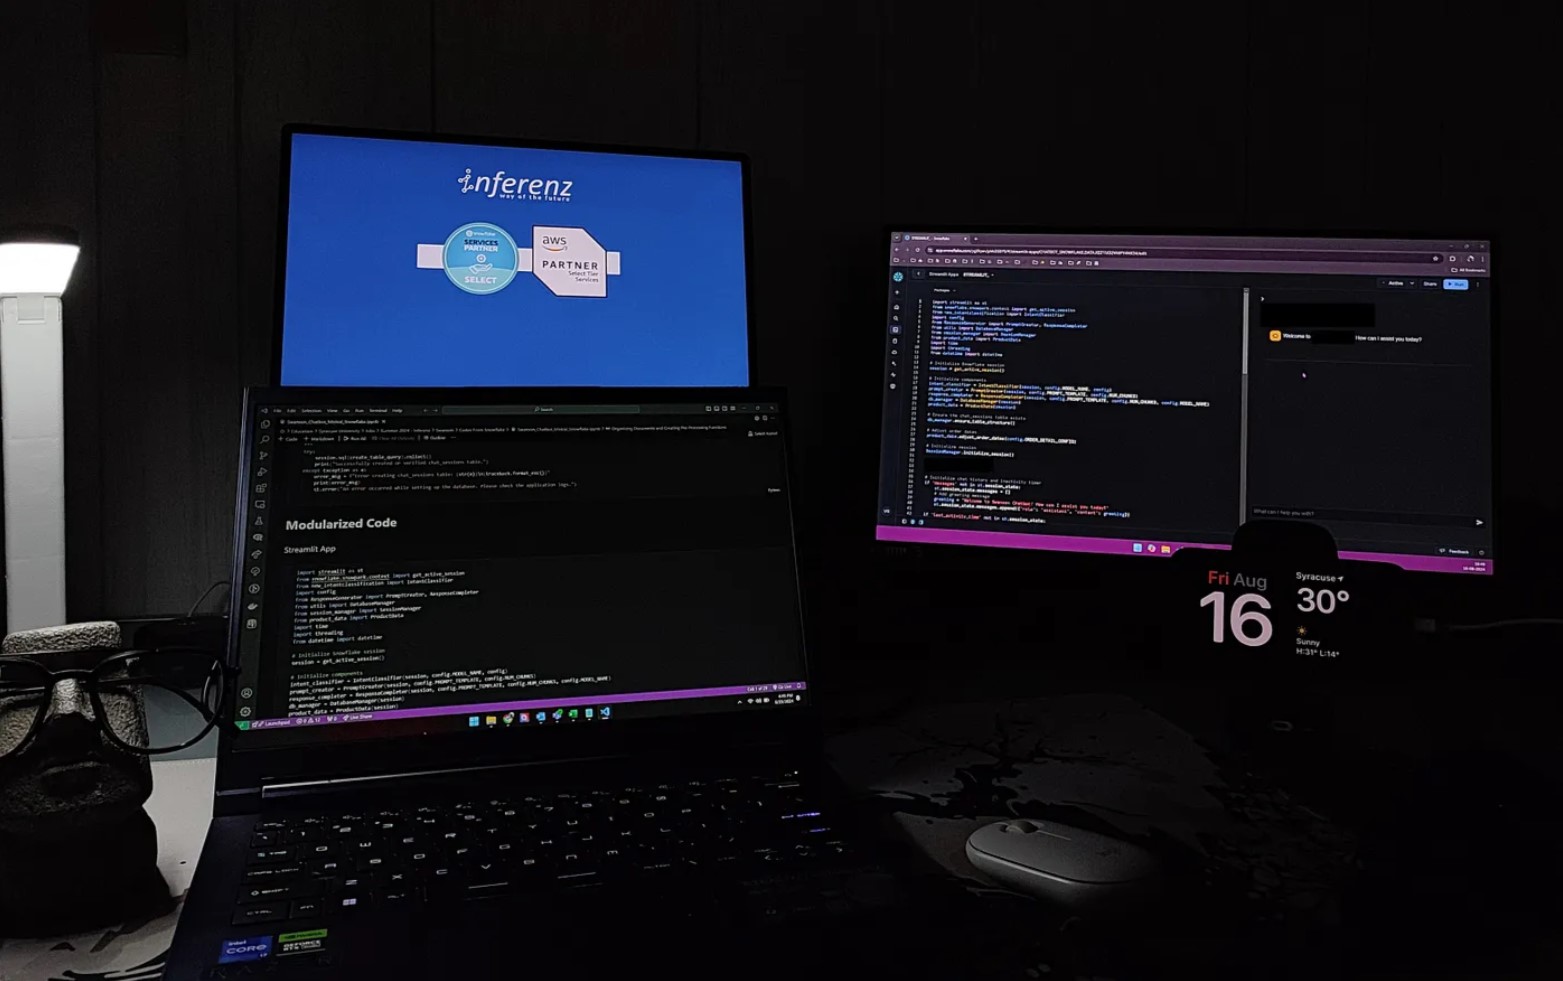
As a Jr. AI/ML Engineer (Intern) at Inferenz, I contributed to the development of scalable, production-ready AI applications with a focus on NLP and generative AI. My work involved optimizing conversational systems and integrating Retrieval-Augmented Generation (RAG) with enterprise-grade infrastructure.
AI-Powered Chatbot Development
Redesigned the chatbot architecture using asynchronous API calls and parallel processing in Snowflake, resulting in faster task handling and improved performance across key NLP workflows.
Prompt Engineering & Token Efficiency
Applied context pruning and advanced prompt design to reduce unnecessary token consumption. Achieved more efficient interactions while preserving the quality of model outputs.
RAG System Implementation
Deployed a RAG pipeline combining OpenAI with a Snowflake-hosted vector store. Integrated semantic search using embeddings to ground responses with contextual accuracy and up-to-date information.
Accuracy & Performance Tuning
Improved chatbot accuracy by leveraging LangChain caching, parallel document handling, and Snowflake’s scalable compute engine—boosting overall response reliability and speed.
Impact Delivered
40%
Reduction in Response Time
28%
Decrease in Token Usage
25%
Improvement in Chatbot Accuracy
✔
Productionized RAG in Snowflake
Tredence Inc.
At Tredence Inc. as Analytics Consultant, I worked with Unilever to deliver data-driven strategies that improved market expansion, store performance, and data pipeline scalability. My role involved forecasting demand, optimizing store placements, and streamlining ETL workflows using cloud and distributed computing platforms.
Store Expansion & Market Intelligence
Forecasted demand and identified optimal locations for 1,200 Unilever stores across 16 markets using geospatial analytics, Power BI, and demographic analysis—contributing over $1M in annual revenue gains through delivery efficiency.
Performed spatial analysis using foot traffic, competitor proximity, and market data to increase profitability by 15% and store visibility by 22%.
ETL Pipeline Development & Automation
Designed scalable ETL pipelines in Databricks and PySpark, integrating and cleaning 52+ CSV data sources to ensure consistent, high-quality data for downstream analytics.
Automated data validation and quality monitoring through custom alert workflows reducing manual checks by 80% while ensuring schema compliance and data integrity.
Dashboarding & Reporting
Built Power BI dashboards with DAX-based KPIs to monitor data completeness, consistency, and accuracy achieving 98% data coverage and improving decision-making efficiency.
Cloud Optimization & Performance Tuning
Used Azure Data Factory and Databricks to optimize data ingestion and scheduling workflows, reducing pipeline latency by 35% while ensuring seamless scalability.
Performed root cause analysis using SQL and profiling tools to diagnose and fix data pipeline bottlenecks—achieving a 20% improvement in processing time.
Agile Project Delivery
Led a team of 3 analysts using Jira and Azure Project Management to execute sprint-based development, ensuring agile delivery and cross-functional collaboration with Unilever stakeholders.
Impact Delivered
$1M+
Revenue from Store Optimization
15%
Increase in Store Profitability
80%
Reduction in Manual QA Checks
35%
Pipeline Latency Reduction
Cognizant
During my internship at Cognizant, I gained foundational experience in backend data handling and front-end web development. I contributed to internal tools by managing databases and creating web interfaces while sharpening my problem-solving and collaborative skills.
Database Management
Developed and maintained efficient relational databases to support project requirements, focusing on scalability and performance.
Implemented optimized data retrieval and transformation logic using SQL queries to enhance data processing speed.
Worked with PostgreSQL and MySQL to ensure secure and structured data handling across modules.
Web Development
Built responsive, interactive web pages using HTML and CSS, improving user experience for internal tools.
Applied mobile-first design principles to ensure accessibility and performance across multiple screen sizes and browsers.
Impact Delivered
Seamless
Back-End Integration for Internal Tools
Accelerated
Transition from Theory to Practical Development
Campus Leadership
Recitation Lead – IST 195
Selected to lead and mentor a class of over 100 undergraduate students for the course "Information Technologies."
Delivered weekly sessions simplifying technical concepts, assisted in exam prep, and served as a bridge between students and faculty.
Board Member – University Conduct Board
Appointed to Syracuse University's Conduct Board to review student conduct cases and uphold the institution’s values of fairness, integrity, and accountability. Worked closely with administration to ensure due process and equitable resolution.
What Others Say
Jeff Rubin
SVP & Chief Digital Officer, Syracuse University
“Shashank consistently went above and beyond as a recitation lead — delivering on time, enhancing the student experience, and contributing meaningfully to the class culture. A natural leader that any team would benefit from.”
Jeff Saltz
Professor, School of Information Studies, Syracuse University
“Shashank is a smart, curious, and hardworking student who consistently goes above and beyond. In our Generative AI class, he led his team in building an impressive chatbot and actively supported his peers — a true reflection of why he earned the Graduate Student Excellence Award.”
Scott Bryan
President & CEO, Macronomics Inc. & Advisor, E78 Partners
“Shashank is a brilliant, driven, and highly skilled data science consultant with a rare ability to turn complex ideas into impactful solutions. His work ethic, leadership, and collaborative mindset make him an asset to any team. I highly recommend him, he will exceed expectations and deliver outstanding results.”
Keval R Menon
Senior Manager (Analytics), Tredence Inc.
“Shashank brought deep analytical thinking, technical expertise, and strong leadership to our data science team. He took initiative on high-impact projects, automated complex pipelines, and consistently delivered results under pressure, all with clarity, ownership, and professionalism.”
Rahul Kumar
Manager, Tredence Inc.
“Shashank has a sharp analytical mind and a knack for solving complex problems. His solutions consistently exceeded expectations, and his collaborative nature made him a valuable asset to the team.”
Archana Mishra
Associate Manager, Tredence Inc.
“From technical execution to research passion, Shashank stood out across projects. His performance on the Unilever initiative and award-winning delivery reflect his excellence and commitment to impact.”
This project focuses on predicting injury risk in basketball players by analyzing their performance and physiological metrics. The model is designed to support sports scientists and trainers in minimizing injury occurrences through early detection and intervention.
Dataset: 2,604 records of 14 players (Jan–Dec 2023), containing performance stats, muscle imbalance data, and injury logs.
Data Analysis: Explored injury trends, positional risk factors, and muscle imbalance patterns using visualizations and statistical methods (p-values, correlations).
Injury Prediction Model:
Random Forest Classifier: Achieved high recall (0.98) for injured players and an AUC of 0.90.
Risk Scoring: Players categorized into Very Low, Low, Moderate, and High risk based on prediction scores.
Key Insights: Muscle imbalances, especially in the hamstring-to-quad and calf regions—were strong predictors. Guards showed the highest average risk.
Challenges: High class imbalance and sparse injury-related fields, requiring careful handling and domain-specific feature engineering.
Anomaly Detection in Auxiliary Power Unit (APU) of Metro Trains
This project focuses on detecting anomalies in the Auxiliary Power Unit (APU) of metro trains using sensor data. The goal is to enable predictive maintenance, enhance system reliability, and minimize downtime by identifying potential failures early.
Dataset: MetroPT dataset with 1,516,948 rows and 17 columns (February to August 2020).
Data Preprocessing: Schema definition, data cleaning, and exploratory data analysis (EDA) using correlation heatmaps and temporal analysis.
Anomaly Detection Techniques:
K-Means Clustering: Identified normal (Cluster 0) and anomalous (Cluster 1) operations.
LSTM Autoencoder: Detected anomalies based on reconstruction error (95th percentile threshold).
Key Results: Anomalies peaked during early morning hours (2 AM - 5 AM) and aligned with recorded failure events.
Challenges: Implementing Isolation Forest and One-Class SVM with PySpark and determining anomaly thresholds.
COMPASS is an AI-powered university guidance system that helps international students find and track university programs, living expenses, and career opportunities in the United States. The system provides personalized recommendations based on user preferences and maintains an interactive chat interface for queries about universities, costs, weather, and job prospects.
Personalized University Recommendations: Based on field of study, budget, location, and weather preferences.
Interactive Chat Interface: Ask about university programs, living expenses, weather conditions, and job market trends.
Application Tracking: Manage applications, deadlines, and document requirements with downloadable templates.
Resource Generation: Generate application checklists in DOCX format and CSV templates for tracking.
This project aims to build a cloud-based data pipeline using Azure services to analyze and visualize the 2021 Tokyo Olympics dataset. The pipeline integrates data ingestion, transformation, and visualization to unlock insights into athlete demographics, country performance, and event participation.
Technologies Used:
Data Ingestion (Azure Data Factory): Automated extraction of data from a GitHub-hosted CSV file into Azure.
Data Storage (Azure Data Lake Gen2): Scalable and secure storage for raw and processed data.
Data Transformation (Azure Databricks): Cleansing and processing data using Spark.
Data Analysis (Azure Synapse Analytics): SQL-based querying and advanced analytics.
Visualization (Power BI): Interactive dashboards displaying insights and performance metrics.
LEAP is a web application that generates a personalized learning path based on users' educational background, skills, and career goals. It leverages AI-driven models to create customized plans that include key concepts, curated resources, and estimated timelines, making it easier for users to achieve their learning objectives.
Built a web application using Python, Streamlit, and the GROQ LLM API to design personalized learning paths.
Integrated AI to recommend curated resources, breaking down complex transitions into actionable steps.
Developed a feature to generate downloadable .docx files for users, enabling structured offline access to their learning plans.
Provided estimated completion timelines and progress tracking, optimizing the user's learning experience.
Designed an intelligent recommendation system to suggest resources from trusted platforms, enhancing learning efficiency.
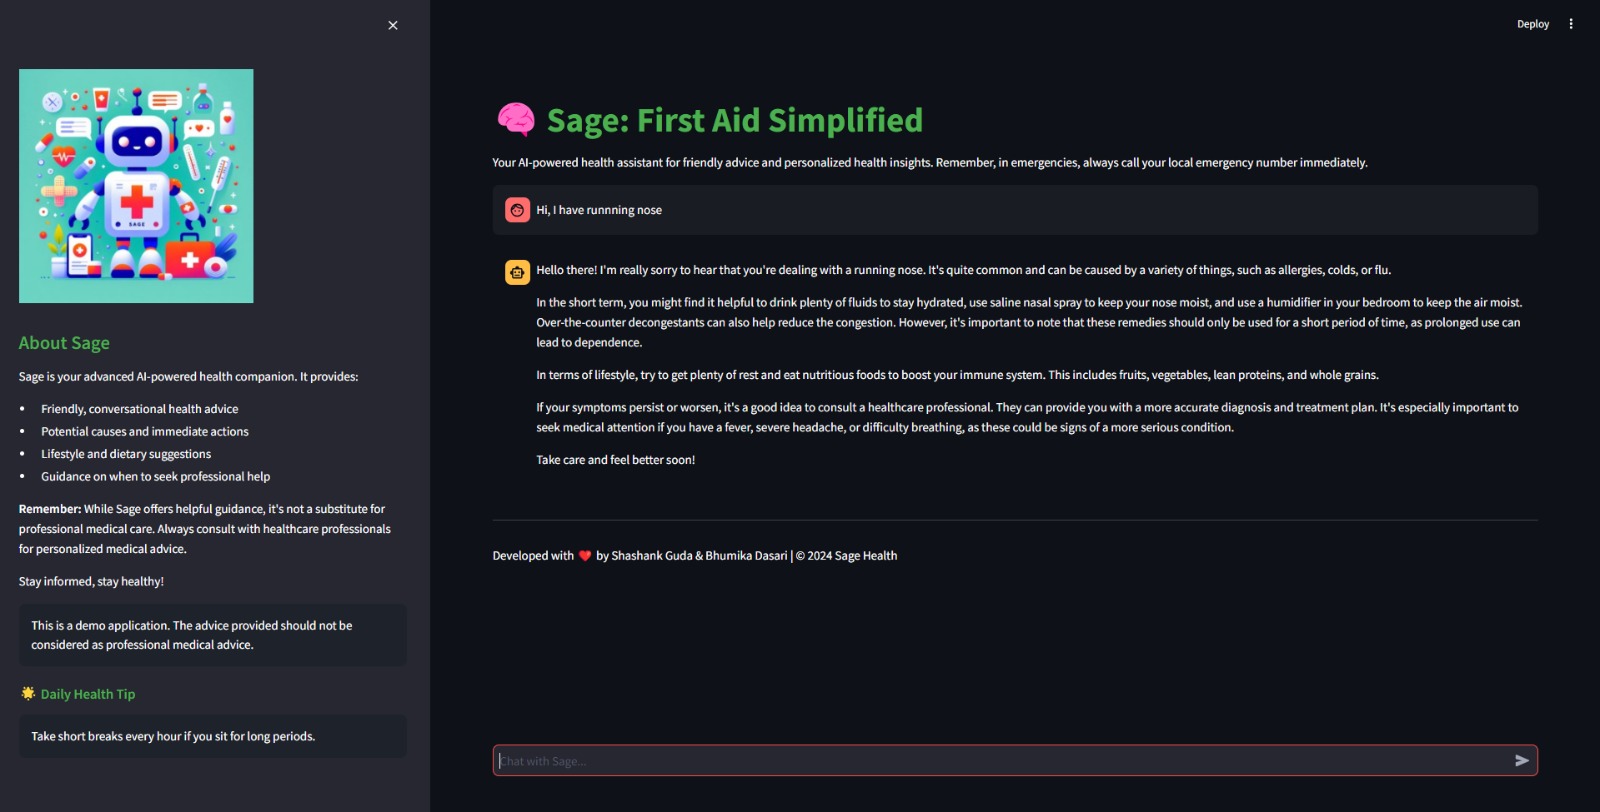
Sage is a health chatbot developed using Python, LangChain, and Streamlit, designed to diagnose injuries and provide probable precautions based on user input. Leveraging advanced natural language processing and machine learning techniques, Sage offers accurate and timely health advice, ensuring users receive relevant information and guidance for their symptoms.
Developed a health-focused chatbot using Python, integrating LangChain for natural language processing and Streamlit for the user interface.
Implemented advanced NLP techniques to accurately interpret user-reported symptoms and health concerns.
Integrated Large Language Models (LLMs) to enhance the chatbot's language understanding and response generation capabilities.
Created an interactive, conversational user experience that provides real-time health advice and injury diagnosis.
Designed the system to offer tailored recommendations based on individual user inputs, ensuring personalized health guidance.
Received recognition through the Wolfram Award, highlighting the project's innovation and potential impact in the health tech space.
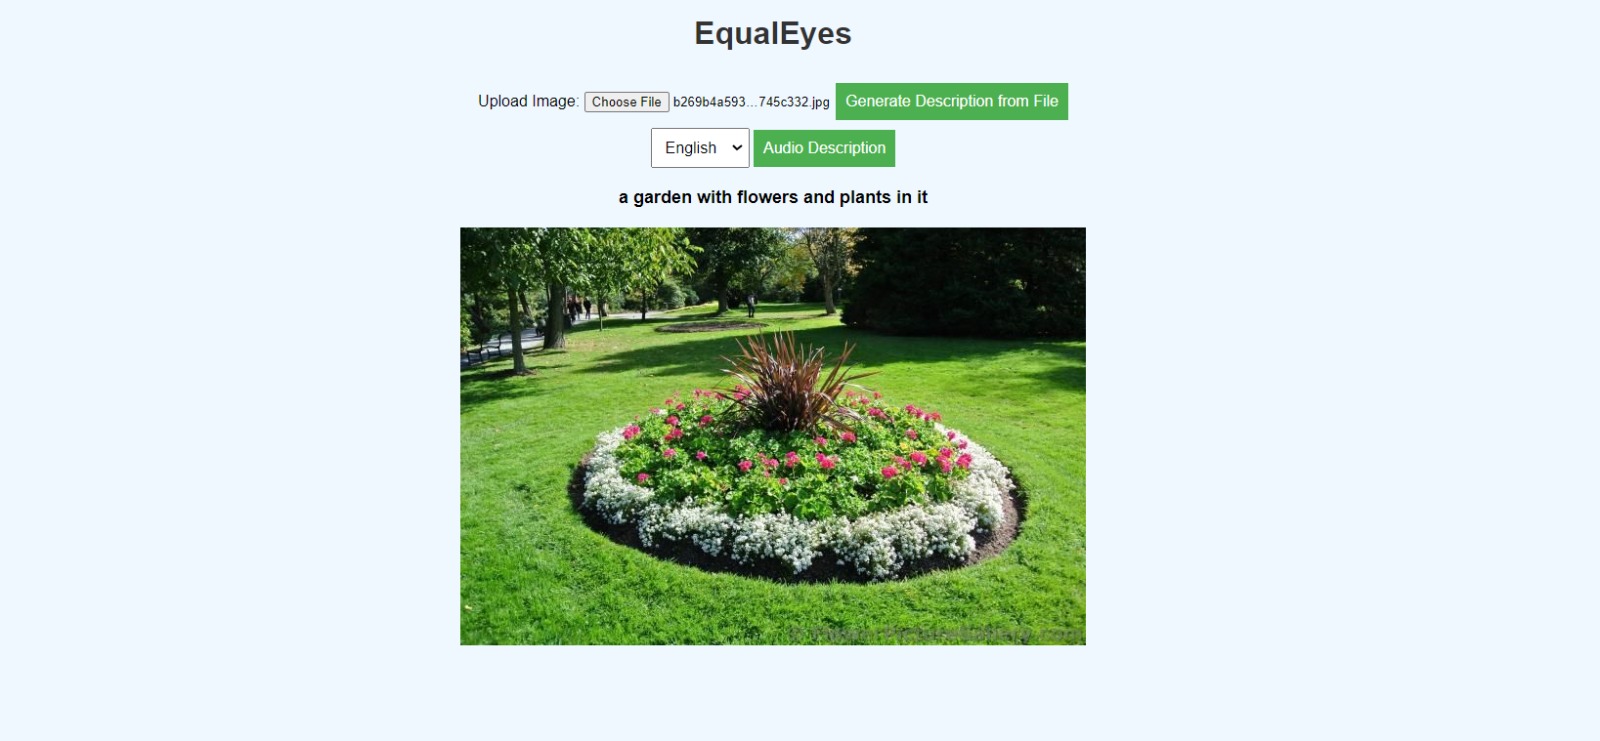
EqualEyes aims to advance image captioning technology by combining recent advances in image recognition and language modeling to generate rich and detailed descriptions beyond simple object identification. Through inclusive design and training on diverse datasets, the project seeks to create a system accessible to all users, particularly benefiting individuals with visual impairments. Stakeholders include visually impaired individuals, educators, and developers.
Developed an image captioning system that generates rich, descriptive captions going beyond naming objects by combining advanced image recognition and language modeling techniques.
Implemented data preprocessing pipelines, including image augmentation, text tokenization, and vectorization to prepare diverse datasets for model training.
Explored and evaluated multiple state-of-the-art model architectures like CNN Encoder-Decoder, Vision Transformers (ViT-GPT2), and BLIP for image encoding and caption generation.
Conducted extensive data exploration and analysis on the image-caption dataset, examining image size/orientation distributions, caption lengths, word frequencies, and image quality assessments.
Implemented evaluation metrics focused on measuring how well generated captions capture the full context of images beyond just object presence.
Developed a working web application that takes images as input, processes them through the trained captioning model, and generates descriptive captions with audio output for accessibility.
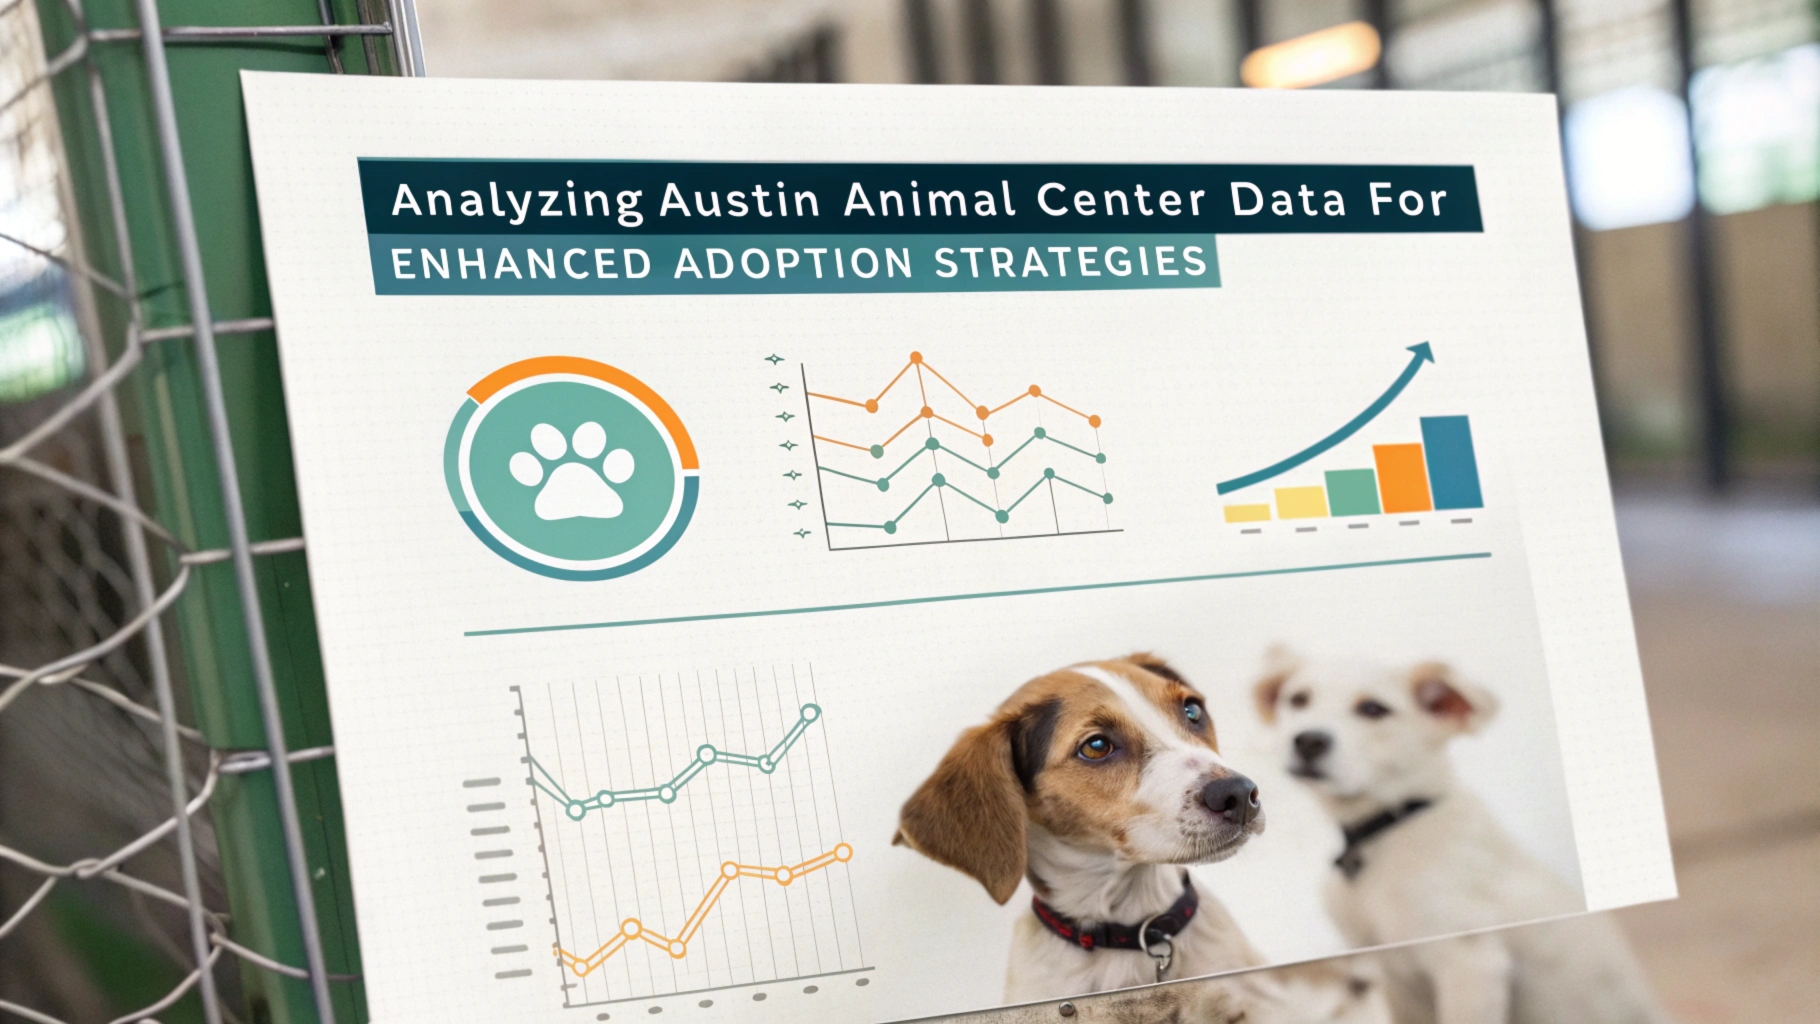
Analyzing Austin Animal Center Data for Enhanced Adoption Strategies
This project involves a comprehensive analysis of data from the Austin Animal Center to understand trends in animal intakes, outcomes, and stray locations. By merging and analyzing multiple structured datasets, project aims to identify factors contributing to stray animal cases and develop strategies to address the issue. The analysis includes exploratory data analysis, preprocessing, and actionable insights to improve adoption rates and animal welfare.
Preprocessed and integrated three datasets (Austin Animal Center Intakes, Outcomes, and Stray Map) by handling missing values, removing duplicates, and performing inner joins to create a unified dataset for analysis.
Conducted exploratory data analysis on the intake dataset to examine distributions of animal types, intake conditions, sexes, ages, and breeds, identifying trends and potential areas of focus.
Analyzed outcome data to determine common outcomes (adoption, transfer, euthanasia) across different animal types, ages, and assessed top breeds for targeted adoption efforts.
Performed geospatial analysis on the stray animal map data, pinpointing urban hotspots and frequent locations for stray animal findings to guide targeted interventions and resource allocation.
Investigated correlations between animal age at intake and outcome to derive insights for optimizing adoption strategies based on age groups and tailoring marketing/fostering approaches .
Developed visualizations, including bar charts, heatmaps, and geographic maps, to effectively communicate key findings and patterns related to intake sources, outcome distributions, and stray locations.
Synthesized analysis results to propose data-driven recommendations for the Austin Animal Center, such as sterilization programs, adoption campaigns, resource allocation, and improvements to recordkeeping and identification practices.
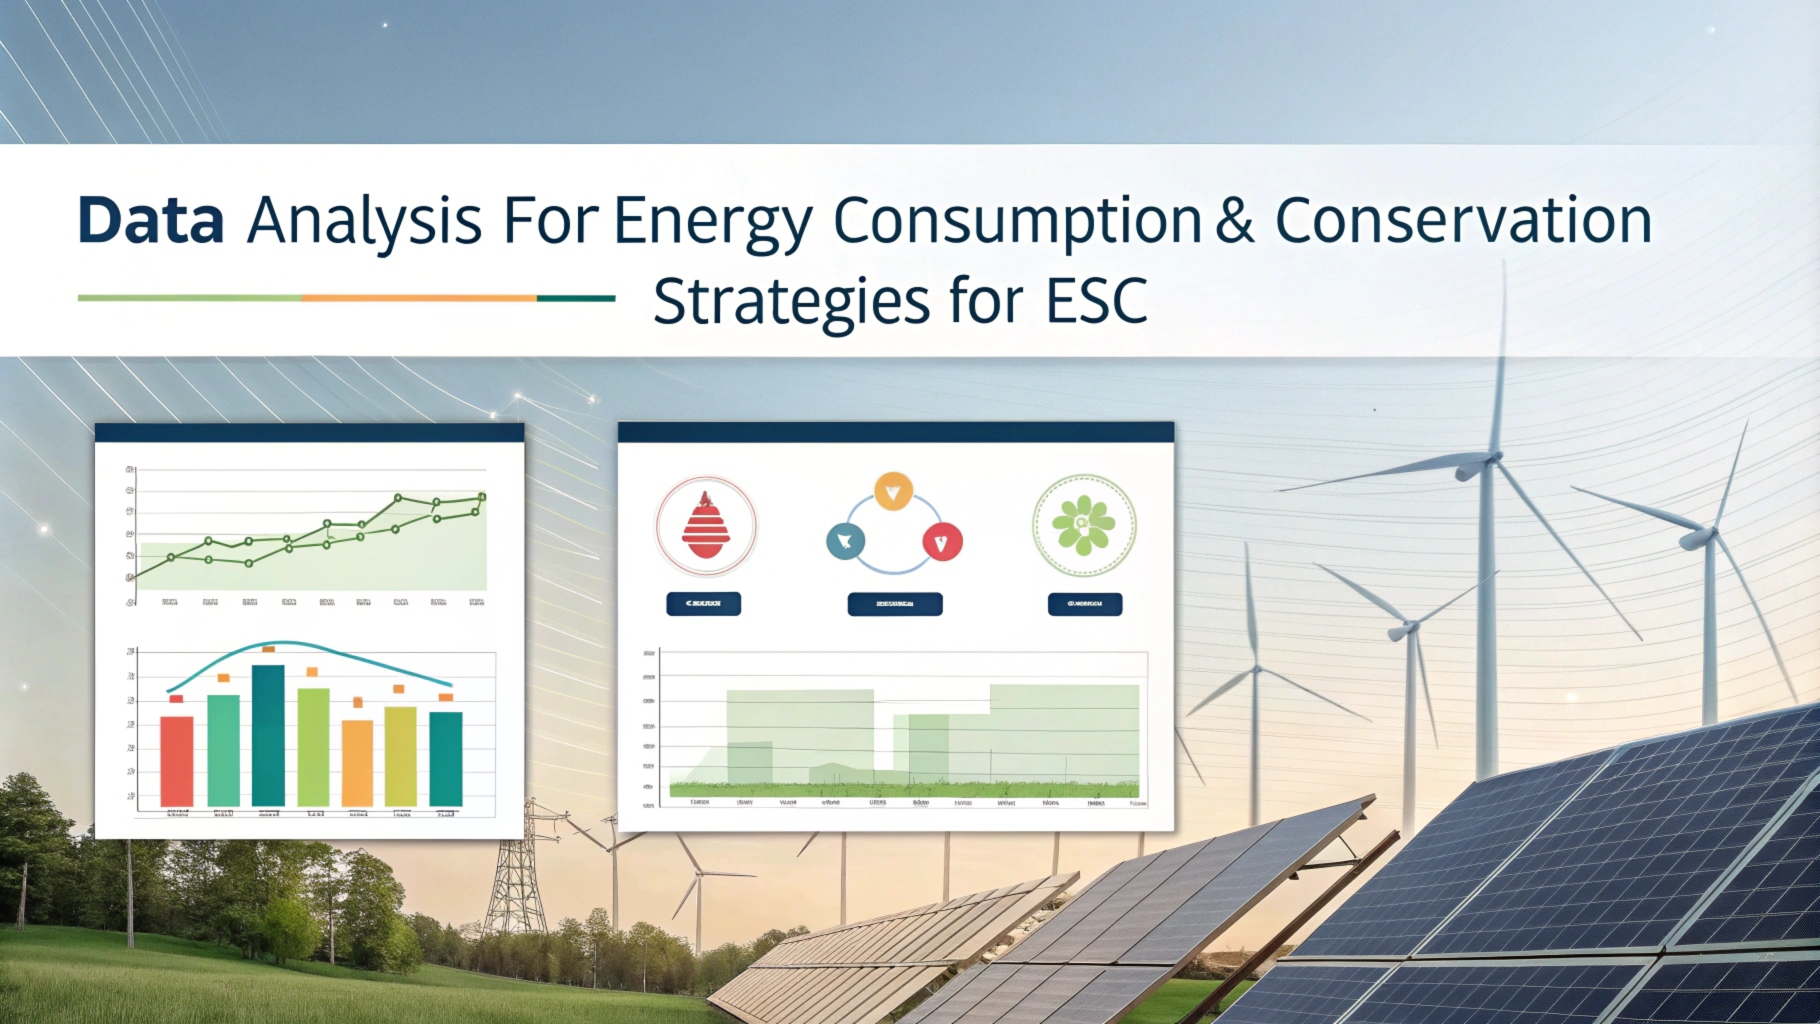
Data Analysis For Energy Consumption & Conservation Strategies For eSC
In this project, we spearheaded a comprehensive analysis of energy consumption patterns with a keen focus on peak demand during the hot summer months, particularly in July. Leveraging a robust toolkit that included R Studio, Shiny app development, and advanced data cleaning and merging techniques, we delved into the intricacies of energy data to derive meaningful insights.
Conducted a meticulous analysis of energy usage data, employing data cleaning and merging techniques to ensure the integrity and accuracy of the dataset.
Utilized R Studio to identify key drivers of high demand during peak periods, specifically in July, shedding light on the factors contributing to increased energy consumption during critical periods.
Developed predictive models using linear modeling, decision trees, and random forest algorithms. These models were instrumental in forecasting future energy demand scenarios, providing a quantitative basis for understanding the potential impact of conservation initiatives.
Formulated strategic recommendations for the Energy Services Company (eSC) aimed at managing demand during peak periods. Explored alternative approaches beyond the traditional method of building additional power plants, considering innovative conservation initiatives.
Presented the comprehensive analysis and strategic plan to key stakeholders, highlighting the findings and recommendations. Customized Shiny app dashboard was utilized to provide an interactive and intuitive platform for stakeholders to engage with the insight
In the creation of Harmony Hub, a Database Management System (DBMS) tailored for a Music Streaming Service, I led the design and development of a robust and comprehensive solution that seamlessly organized and stored data related to tracks, artists, and streaming history.
Technologies Used:
Designed and developed an end-to-end music streaming database solution using SQL and Microsoft Data Studio. This encompassing solution provided a structured and efficient platform for organizing a vast array of data, ensuring optimal performance.
Engineered optimized table schemas to efficiently ingest streaming data from source systems. These schemas were meticulously designed to transform raw streaming data into analysis-ready datasets, laying the foundation for detailed usage analytics.
Implemented a streamlined process for ingesting streaming data from various source systems, ensuring the continuous flow of information into the database. This facilitated real-time updates and maintained the integrity of the dataset.
Utilized the power of SQL queries and stored procedures to grant key stakeholders self-service access to streaming analytics. This empowerment enabled decision-makers to delve into usage patterns, contributing to data-driven decision-making in areas such as artist payments and content recommendations.
The implementation of self-service analytics played a pivotal role in enhancing decision-making processes related to artist payments and content recommendations. Stakeholders could navigate and extract insights independently, fostering a more agile and responsive approach to business strategies.
This is bold and this is strong. This is italic and this is emphasized.
This is superscript text and this is subscript text.
This is underlined and this is code: for (;;) { ... }. Finally, this is a link.
Heading Level 2
Heading Level 3
Heading Level 4
Heading Level 5
Heading Level 6
Blockquote
Fringilla nisl. Donec accumsan interdum nisi, quis tincidunt felis sagittis eget tempus euismod. Vestibulum ante ipsum primis in faucibus vestibulum. Blandit adipiscing eu felis iaculis volutpat ac adipiscing accumsan faucibus. Vestibulum ante ipsum primis in faucibus lorem ipsum dolor sit amet nullam adipiscing eu felis.
Preformatted
i = 0;

while (!deck.isInOrder()) {
    print 'Iteration ' + i;
    deck.shuffle();
    i++;
}

print 'It took ' + i + ' iterations to sort the deck.';